




Empirical analysis of impacts, cost-benefit assessment, and optimization of interventions for the case study

RA4 aims at providing the development plan to be applied in the last phase of the project, namely the adaptation of the model to the characteristics of the research context. The definition of the tools will allow to empirically analyse the impacts of the measures identified in the previous phases. Cost-benefit technique will be exploited to appraise feasibility, costs and benefits of the listed interventions. This activity is linked to the keyword ‘Circularity Assessment’.
The selection of the interventions allowing to maximise symbiotic behaviour in the selected IP and the quantification of the amount of public support required will be performed through a multi-objective optimisation model. The activity is conducted jointly by RU1 and RU2, with RU1 leading the analysis using Multicriteria analysis, Cost-Benefit Analysis, and multi-objective optimization techniques.
Duration: Year 2 — Bimesters 3 to 5
Status: Completed
Lead: RU1 — University of Naples “L’Orientale” (RU2 contributes)
Selection of the most suitable assessment methods (micro- and meso-levels), developing a bottom-up data estimation methodology using primary data from responding companies to validate the top-down approach of RA2.
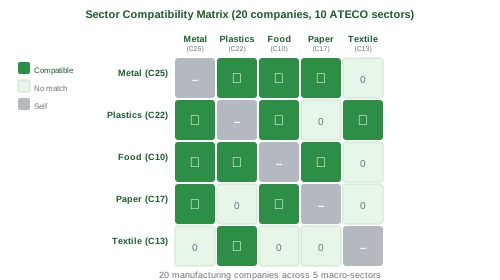
Analysis and interpretation of data, constructing a 20×20 binary compatibility matrix mapping potential connections between all manufacturing companies and deriving waste generation coefficients by ATECO sector.
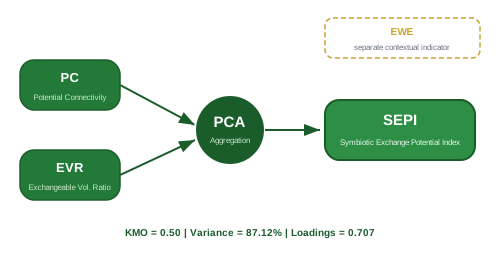
Calculation of the impacts of the measures identified in the Development Model, using three final indicators: Potential Connectivity (PC), Exchangeable Volume Ratio (EVR), and Economic Waste Efficiency (EWE), aggregated into the Symbiotic Exchange Potential Index (SEPI).
Estimation of the average costs and benefits from the implementation of each intervention, analyzing four priority waste streams (metals, organic waste, plastics, paper) across baseline, individual platform adoption, and aggregated collection scenarios.
Identification of the Optimal solution for the reference case study through a linear integer programming model (simplex algorithm) using Goal Programming approach, comparing ‘Ideal’ (theoretical benchmark) and ‘Best Compromise’ (policy-constrained) scenarios.
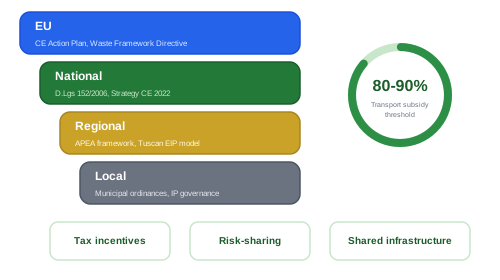
Quantification of the required public incentives, analyzing legal frameworks for waste management and financial instruments for CE implementation, determining that approximately 80–90% transport cost subsidies are needed for platform viability.
A bottom-up data estimation methodology was developed using primary data from responding companies. Four indicator selection criteria were applied (data calculability, zero-state informativeness, operational simplicity, aggregation compatibility), resulting in three final indicators: Potential Connectivity (PC), Exchangeable Volume Ratio (EVR), and Economic Waste Efficiency (EWE). Principal Component Analysis (PCA) was used to construct the Symbiotic Exchange Potential Index (SEPI) from PC and EVR, with KMO = 0.50 and 87.12% variance explained.
A 20x20 binary compatibility matrix was constructed mapping potential connections between all manufacturing companies. Waste generation coefficients were derived by ATECO sector using Python scripts. The analysis revealed high sectoral diversity (10 ATECO sectors) but waste concentration within few firms, with single producers dominating plastic and organic streams. Three sectors (plastics, food processing, metal products) account for the vast majority of waste generation.
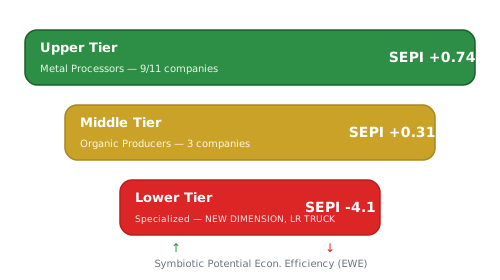
The SEPI ranking revealed an inverse correlation between symbiotic potential and economic efficiency: high symbiotic potential firms tend to generate substantial waste relative to revenue. Upper tier: metal processing companies (highest SEPI, positive economic outcomes from aggregation). Middle tier: organic waste producers (high matchability but unfavorable baseline economics). Lower tier: mixed outcomes depending on waste stream characteristics. The results demonstrate that firms with the greatest exchange potential also face the most challenging economic dynamics.
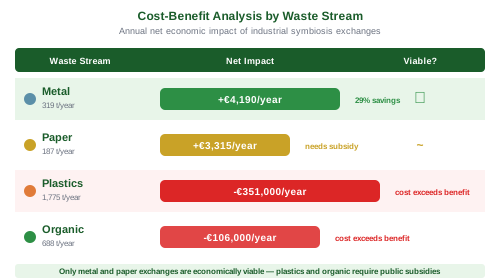
Comprehensive cost-benefit analysis across four priority waste streams using Borsino Rifiuti platform pricing: Metal waste is the only stream with unambiguous net benefits — aggregation saves 29% (cost falls from €32.45/t to €23.00/t), yielding €4,190 in annual savings. Paper shows conditional viability dependent on baling equipment, with aggregated scenario yielding net positive €3,315/year. Plastics present unfavorable economics (€351,000 annual cost for the dominant producer). Organic waste platform adoption is economically unviable versus the current zero-cost baseline.
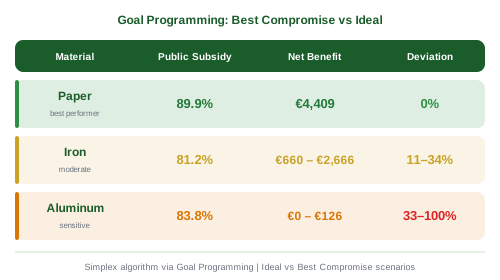
A linear integer programming model (simplex algorithm) using “What’s Best” software identified optimal and best-compromise solutions through Goal Programming. Results: paper requires 89.9% public contribution to transport costs with net benefit of €4,408.63 (no deviation from ideal). Iron requires 81.2% transport incentive with net benefits ranging €659.94–€2,665.50. Aluminum requires 83.8% transport incentive, but at 30% cashback net benefit is €0 (100% deviation from ideal), demonstrating the critical sensitivity to policy parameters.
Analysis of the Italian legal framework for waste management and financial instruments for CE implementation. The model demonstrates that public incentives of approximately 80–90% on transport costs can make platform adoption viable for all participants under individual transactions. The analysis covers regulatory requirements for waste exchange, available financial support mechanisms, and specific implications for the Fosso Imperatore IP, providing clear policy recommendations for enabling the Development Plan’s implementation.
Report detailing the Development Plan and its application to the case study — Indexes and sub-indexes for assessing the impact of proposed interventions; feasibility and socioeconomic evaluation of the Development Plan; projects selection and incentives quantification for achieving solutions in the reference area.