


In-depth analysis of Fosso Imperatore IP ecosystem, its characteristics, resource flows and actors involved

RA2 transitions from theoretical exploration to empirical contextual understanding, focusing on the specific characteristics, dynamics, and potential of the Fosso Imperatore Industrial Park in Nocera Inferiore, Campania. This “Studying” phase involves defining the industrial system boundaries, interpreting the constituent elements as a biological system in which actors operate (produce, use-consume, etc.) and relate with other actors and the local environment. The mapping of the pre-existing flows and the related balances complete the functional picture of the IP analysed. The activity is linked to the keywords “Local Development” and “Circular Economy”.
Data collection methodology integrates indirect sources (documents, reports, datasets) with direct investigative methods (on-site visits, interviews, questionnaires), SWOT Analysis, and Material Flow Analysis (MFA).
Duration: Year 1 — Bimesters 2 to 5
Status: Completed
Lead: RU2 — University of Messina
Assessment of the most relevant flows at territorial (meso-) and local level (micro), establishing material exchange patterns through Material Flow Analysis and quantitative assessment of waste streams within the Fosso Imperatore Industrial Park.
Identification of the stakeholders operating in the IP and their interactions modes, mapping all actors involved in the ecosystem including firms, local authorities, waste management operators, and community groups.
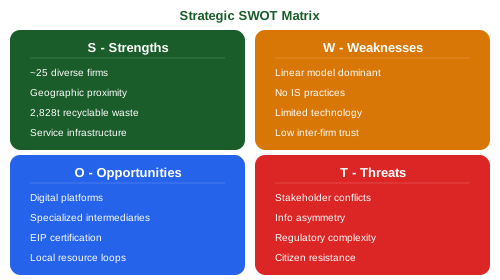
Identification of strengths, weaknesses, criticisms and opportunity for the linear-circular transition, assessing the IP's potential for circular economy implementation through a comprehensive strategic assessment.
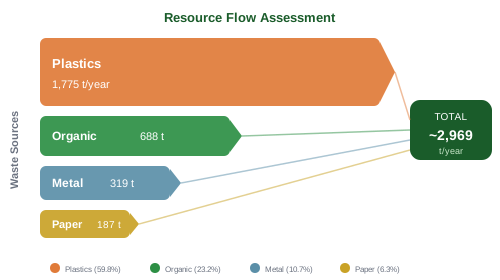
Material Flow Analysis using Python scripts with a top-down approach utilizing ISPRA and ISTAT databases revealed the park generates approximately 2,969 tons of potentially recyclable waste annually, with plastics representing the dominant stream (1,775 tons). Three sectors (plastics, food processing, metal products) account for the vast majority of waste. Sankey diagrams were developed to visualize material flows across the most relevant waste-generating firms, providing a comprehensive metabolic profile of the industrial park at both micro-territorial and meso-local levels.
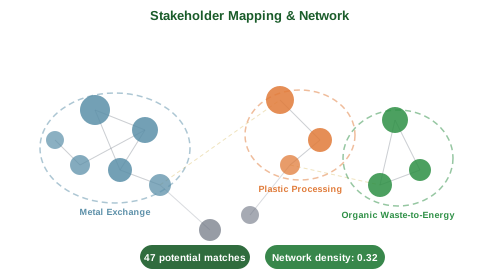
Network analysis identified 47 potential symbiotic matches based on material compatibility and geographic proximity. The analysis revealed significant implementation barriers: companies preferentially select external waste management pathways despite internal exchange potential, while information asymmetry, limited trust between firms, and regulatory complexity hinder cooperation. The relationship between municipal administration and businesses shows both collaborative and conflictual elements, including conflicts of competence with ZES (Special Economic Zone). Citizen groups (e.g., ‘Rete NO PIP’ network with 552 signatures) contest industrial expansion.
The strategic assessment identifies the park’s moderate production diversification (agri-food, mechanics, scaffolds, textile) and service infrastructure as foundational strengths for a circular transition. Critical weaknesses are linked to information asymmetry, limited inter-firm trust, and conflicts of competence with institutional actors. Major opportunities lie in digital technologies for overcoming information barriers and closing local resource loops. These potential gains are counterbalanced by threats such as citizen resistance to industrial expansion, regulatory complexity, and the challenge of coordinating multiple independent firms within a shared territorial framework.
Evolutive taxonomy contexts Map; Integrated Context Analysis Report — A context analysis (and map) based on RA1 objectives integrating structural-morphological dimensions assessment and flows analysis.